Analytical Service for Validation of Inhibitors of Nucleotide Synthesis
Principle:
Cellular Nucleotide Profiling Service is an analytical service for mesuring nucleotide level in antimetabolite-treated cells. More than 31 cellular (deoxy-) ribonucleotides (mono-, di-, and triphosphate) are extracted by SPE procedure, separated by ion-paired HPLC system in one-run and quantified.
| Assays |
Targeted Enzyme(s)
/ Targeted Nucleotide Synthesis Pathway |
Antimetabolite |
|---|---|---|
| Cellular Assay for IMPDH inhibitors |
Inosine Monophosphate Dehydrogenase
(IMPDH) |
Ribavirin
Mycophenolic Acid (MPA) |
| Cellular Assay for RNR inhibitors |
Ribonucleotide Reductase
(RNR) |
Hydroxyurea (HU)
Gemcitabine |
| Cellular Assay for Antifolates |
de novo Purine synthesis:
GAR transformylase, AICAR transformylase Thymidylate Synthase (TS) |
Methotrexate (MTX) |
Validated with antimetabolites (known inhibitors of nucleotide synthesis): MPA, hydroxyurea, methotrexate, ribavirin, mizoribine, leflunomide, gemcitabine. These reference drugs do impact differently on nucleotide metabolism, each showing its own mode of action through a specific nucleotide profile. Any new compound's mode of action is analyzed by establishing its nucleotide profile which is then compared with those obtained with reference drugs.
Download our brochure "Mode of Action Studies by Nucleotide Profiling"
Cellular Nucleotides Profiling - Analytical Service
To study the effect of nucleoside analogues on the whole spectra of cellular purine and pyrimidine ribo- and deoxyribonucleotides, NOVOCIB has developed an original cell-based analytical approach in which more than 31 (deoxy)ribonucleotides (mono-, di-, triphosphate) and nucleotide co-factors are extracted from cultured cells, separated by ion-pared chromatography and quantified.
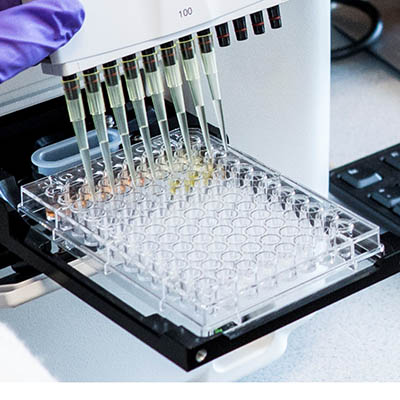
Cells teatment
Nucleotides extraction (SPE)
Nuclotides ldentification and Quantification
Nucleotide pofile
These cellular assays were validated with anti-viral and anti-cancer nucleoside analogues (e.g. ribavirin, gemcitabine) and known anti-metabolites (mycophenolic acid, leflunomide, hydroxyurea, methotrexate).
Cellular Assay for IMPDH inhibitors
Aim: This Research Contract Service has been specially tailored to validate Inosine Monophosphate Dehydrogenase (IMPDH) inhibition by a given compound in cultured cells. The assay consists in extracting, identifying and quantifying by HPLC the intracellular concentration of guanosine nucleotides (GMP, GDP and GTP) and IMP in cells treated by a compound. This cellular assay was validated with mycophenolic acid (MPA), ribavirin and mizoribin, recognized inhibitors of IMPDH. When applied for the study of nucleoside analogues (NA), this assay can also reveal the formation of their mono-, di-, and triphosphate forms, indicating that nucleoside analogues enter the cells and are readily phosphorylated by cellular kinases.
Know more about NOVOCIB'S Cell-based IMPDH inhibiton assay
Cellular Assay for RNR inhibitors
Aim: This Research Contract Service has been specially tailored to validate Ribonucleotide Reductase (RNR) inhibition by a given compound in cultured cells. The assay consists in extracting, identifying and quantifying by HPLC the intracellular concentration of deoxynucleotides di- and triphosphate in cells treated by a compound. The assay was validated with hydroxyurea and gemcitabine in HeLa cultured cells.
Know more about NOVOCIB'S Cell-based RNR inhibiton assay
Cellular Assay for Antifolates
Aim: This Research Contract Service has been specially tailored to validate inhibition of de novo biosynthesis of purine and pyrimidne nucleotides by a given compound in cultured cells. After incubation of cultured cells with the inhibitor, nucleotides are extracted, separated, identified and quantified by UV-HPLC. The assay was validated with methotrexate in HeLa cultured cells.
Know more about NOVOCIB'S Cellular assay for Antifolates
Customized Nucleotide Analysis
NOVOCIB has initially developed its expertise in Nucleotide Analysis to study the drug impact on the cell metabolism of nucleotides. The methodology we implemented allows us to extend the application field of NOVOCIB's expertise in nucleotide analysis and to provide nucleoside analysis services for many other purposes such as, for instance, life science or food quality control.
Extracts from cultured cells, blood cells, body fluids are routinely analyzed in our lab but many other materials can be subjected to a feasibility study for nucleotide analysis. Please feel free to contact us for any question.
Amis: Analysis of the Nucleoside and Nucleotide content in biological samples.
The Nucleotide Analysis procedures implemented by NOVOCIB have been specially developed to study the impact of drugs on the cell metabolism of nucleosides and nucleotides by comparison of metabolic profiles of treated vs. untreated cells. However, Nucleotide Analysis can be a major concern for many other purposes and NOVOCIB's know-how can be adapted for the analysis of other materials. Examples of nucleotide analysis are presented in detail on this website: Baby Milk analysis, Fish / Seafood Freshness control... (see the related links above right for further detail).
The technical presentation of NOVOCIB's Customized Nucleotide Analytical services is presented here through the example of application field for which it has been first developed: analysis of drug-treated and untreated cells. In this case, it enables to:
- reveal the metabolic changes due to the drug action, either on the purine or on the pyrimidine pathway,
- identify the metabolites whose levels are modified by the drug treatment,
- trace back to the metabolic step(s) altered by the drug, and to its likely target(s).
Cell culture and treatment: The choice of the cell line and culture conditions has been optimized to get highly reproducible results. Assays are usually done with human hepatoma cell line Huh7. Cells are grown in DMEM supplemented with FCS (5%), glutamine (1mM), sodium pyruvate (1mM) and maintained in exponential phase. Cells are seeded on 10cm-dishes and allowed to adhere overnight. The drug is added next day at the agreed concentration and at a cell confluence of about 50%. The following metabolites are routinely analyzed*:
| ATP | ADP | AMP | Uridine | Hypoxanthine | |
| GTP | GDP | GMP | dGTP | Tryptophane* | |
| UTP | UDP | IMP | dATP | ||
| CTP | Uracyl | CMP | dTTP | ||
| Cytidine | Guanine | Guanosine | Adenosine |
Cultured cell: Nucleosides and Nucleotides Analysis is usually performed by extraction of ≈107 treated cells, per compound and per concentration tested. Control untreated cells are cultured under the same conditions to provide a reference metabolic profile.
Depending on the cell line or the experimental conditions, a 0.5-1.105 cell-extract can be sufficient to analyze the major metabolites (e.g. ATP, ADPµ).
Blood cells: Typically, a 200µl-sample of blood is sufficient to analyze the major metabolites in Red Blood Cells (RBC), and a 1ml-sample for Peripheral Blood Mononuclear cells(PBMC).
If needed, for instance to focus on naturally low-level metabolites, larger samples can be prepared, e.g. up to 108 of cultured cells.
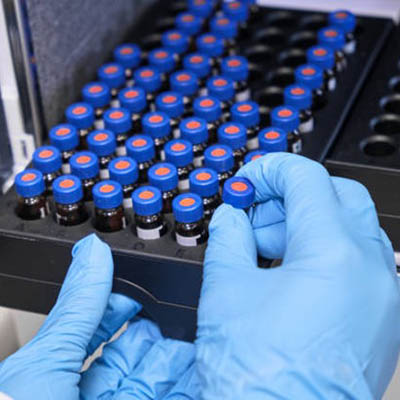
Nucleosides & nucleotides separation and analysis: The extraction and separation procedures have been optimized and specially developed by NOVOCIB. After a 48h-treatment, nucleosides and nucleotides are extracted; Nucleosides, nucleotides mono-, di-, and triphosphates, deoxynucleotides triphosphates and bases are separated by ion-pairing HPLC (Agilent 1100) with a Zorbax EclipsePlus C18 column and quantified using an Agilent ChemStation software. The resulting values are normalized by cell number. A mixture of 30 authentic standards (Sigma Aldrich, Roth) is run before and after every set of samples analysis.
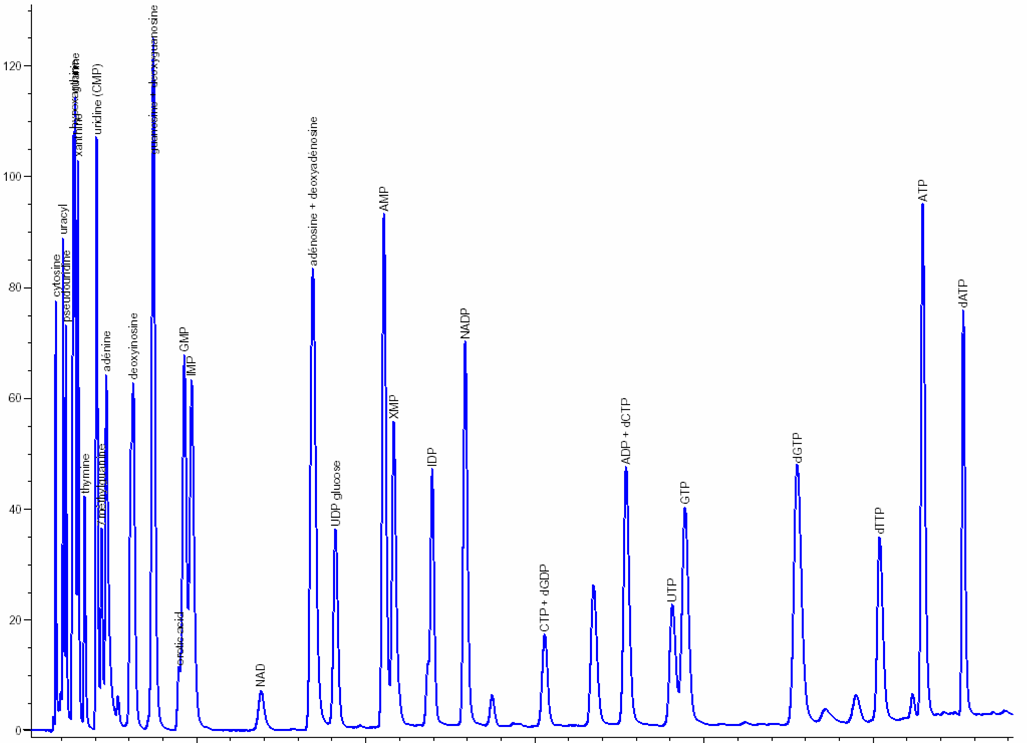
Click to enlarge
Click to enlarge
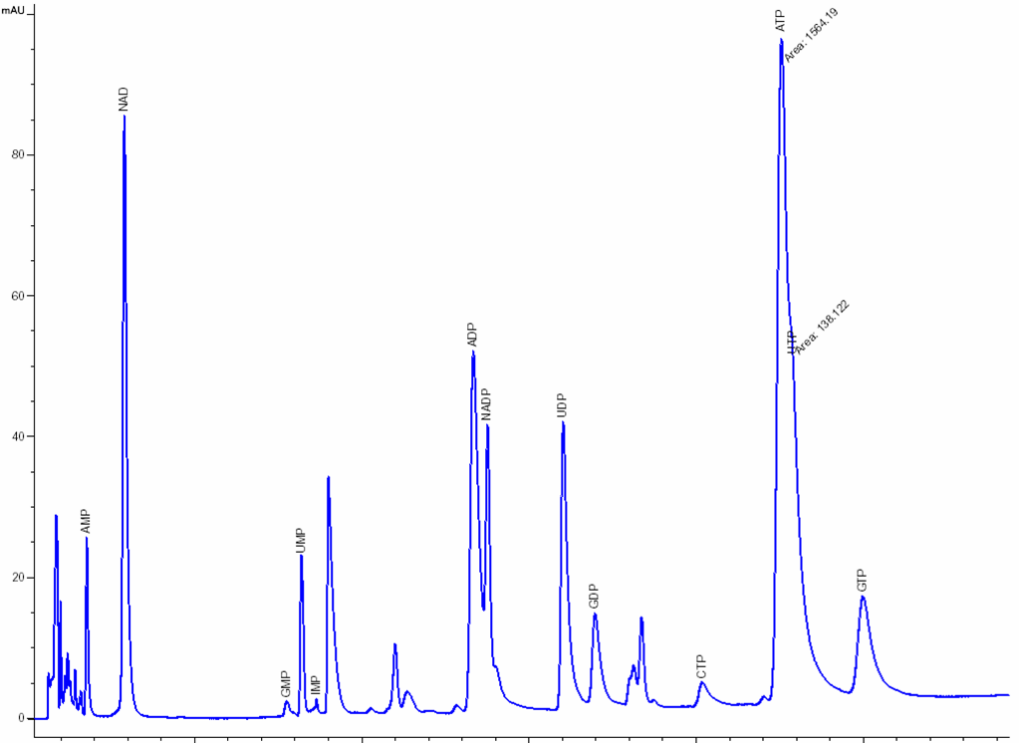
| Metabolites | pmol / 10 6 cells * | Published data ** | |
|---|---|---|---|
| UMP | 728.1 | ± 56.8 | |
| GMP | 34.4 | ± 4.8 | |
| IMP | 72.7 | ± 21.4 | 130 |
| NAD | 1,825.1 | ± 155.5 | |
| UDP-Glu | 1,113.9 | ± 87.1 | |
| AMP | 122.7 | ± 12.9 | |
| UDP | 1,730.3 | ± 207.1 | |
| CTP | 2,754.5 | ± 165.4 | |
| ADP | 4,652.4 | ± 609.8 | |
| UTP | 2,494.2 | ± 156.1 | |
| GTP | 1,449.7 | ± 81.4 | 1,540 |
| ATP | 6,561.0 | ± 346.0 | 6,580 |
|
* Mean ± SD for 5 independent experiments
** J. Balzarini et al. (1993) |
|||
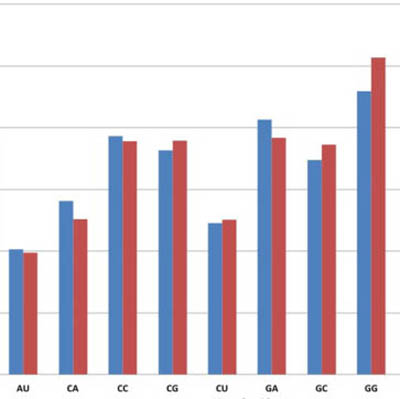
Nucleotide profiling: For every nucleotide and nucleoside metabolite, drug-treated / non-treated cells concentration ratios are calculated and graphically reported. The base line indicates the control level.
Eicar (5-ethynyl-1-beta-D-ribofuranosylimidazole-4-carboxamide). A novel potent inhibitor of inosinate dehydrogenase activity and guanylate biosynthesis