PRECICE® IMP, Inosine and Hypoxanthine Assay Kit
Spectrophotometric, microplate format
Freshness Test
Fish muscle is particularly rich in ATP, which is a most abundant muscle metabolite after amino acids. Post-mortem degradation of ATP in fish muscle is a well-documented process that has significant implications for food quality and shelf life.
ATP ➜ ADP ➜ AMP ➜ IMP ➜ inosine ➜ hypoxanthine![]() uric acid
uric acid
Following slaughter, ATP continues to be hydrolyzed by contracting muscles; however, its resynthesis by mitochondria becomes impossible in the absence of oxygen. Within just a few hours, ATP, ADP, and AMP are enzymatically converted into IMP, which becomes the predominant nucleotide in fresh fish (Wang et al., 1998). During the first few days of storage, IMP levels gradually decline, primarily due to the activity of autolytic enzymes that hydrolyze IMP into inosine. Inosine is subsequently hydrolyzed into hypoxanthine by both autolytic and bacterial enzymes. Since fish muscle lacks xanthine oxidase—an enzyme that converts hypoxanthine into uric acid—these processes lead to the progressive accumulation of hypoxanthine, the final product of ATP degradation in fish. This accumulation has been shown to correlate with spoilage and coincides with the formation of volatile amines in cod (Dalgaard et al., 1993). Although the post-mortem ATP degradation pathway is universal, the rate of IMP degradation and hypoxanthine formation varies considerably among fish species and depends on handling and storage conditions (Surette et al., 1988).
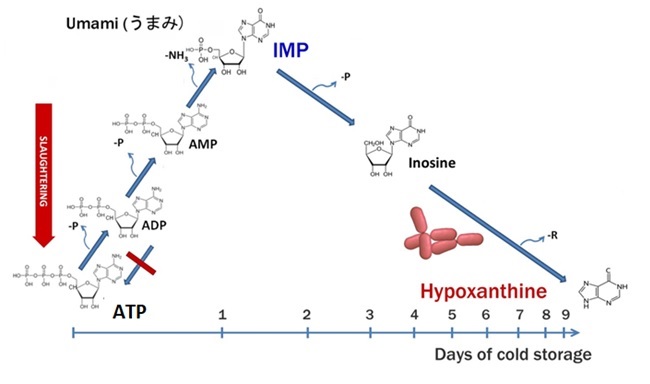
Post-Mortem ATP Degradation Pathway in Fish Muscle
Kit principle:
PRECICE® IMP, Inosine, and Hypoxanthine Assay Kit has been specifically designed in a 96-well plate format to facilitate the measurement of three major ATP catabolites in the same fish sample. The microplate is supplied prefilled with specific enzymes that irreversibly convert three nucleotides - IMP, inosine and hypoxanthine to one common substance - NADH2. After addition of boiled fish extract to microplate well and 30 min incubation, NADH is quantitatively measured at a wavelength of 340nm using microplate reader. These absorbance data can be used to calculate K-value, H-value or other values:
Kit specifications:
| Format: | 96-well plate |
| Tests per kit: | 6 or 12 |
| Type: | Quantitative |
| Method: | Enzymatic reaction |
| Incubation time: | 30 min |
| Incubation temperature: | 30°C |
Buy the Kit
Kit composition:
- "Reaction Buffer"
- "Cofactors"
- Microplate prefilled with lyophilized enzymes sealed.
Simple Workflow
- Cook & Clarify: Boil the fish, then homogenize and clarify by filtration or centrifugation.
- Sample Loading: Add 200 µL to four wells in the same column.
- Incubation: Incubate for 30 min at 30°C to enzymatically convert IMP, inosine, and hypoxanthine into NADH2.
- Measurement: Read absorbance at 340 nm using a microplate reader.
- Data Analysis: Calculate absolute or relative molar concentrations from absorbance values using dedicated formulas.

🧬 Advantages of the PRECICE® IMP, inosine, hypoxanthine Assay Kit
📊 Quantitative
- Measures IMP, inosine, and hypoxanthine
- Calculates freshness indices like H-value and Fr-value
📏 Accurate
- Wide linearity range
- Recovery 85–100%
⚡ Fast
- Prep time: 5 min (fresh fish) / 20 min (frozen fish)
- Enzymatic reaction: 30 min
🌍 Wide Application Range
- ATP catabolites are universal indicators
- Thermostable & non-volatile—unlike TVA
- Detects early spoilage, unlike TVA
🧪 One-Step (Add-and-Measure)
- Boil (frozen) or microwave cook (fresh fish)
- Add clarified extracts to prefilled microwells
Specificity
No interference with other nucleotides 5NMP (AMP, GMP, CMP or UMP), nucleosides (adenosine, guanosine, cytidine or uridine) or heterocyclic bases (adenine, guanine, cytosine or uracyl).
Linearity range:
For each nucleotide (IMP or hypoxanthine or inosine) the assay is linear between 0.1AU-1.6AU, corresponding to 0.2mmols/Kg to 6mmols/Kg of nucleotide after 20-fold dilution.
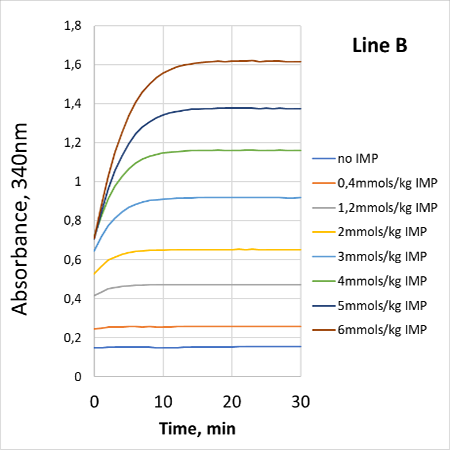

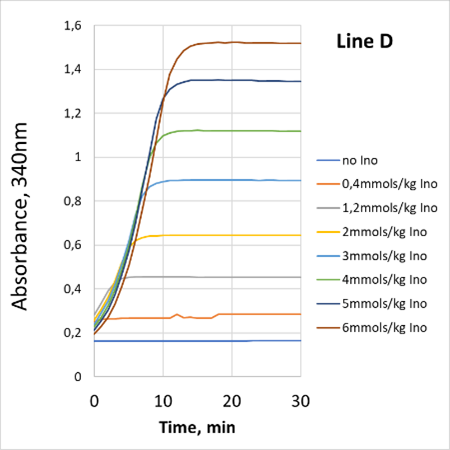
The reactions were followed at 30°C using PRECICE® microplate (30°C, 200µL per well) and Labsystems iEMS Reader (Thermo).


Calibration curves for IMP, inosine and hypoxanthine obtained using PRECICE® IMP, inosine, and hypoxanthine Assay kit.
Recovery:
IMP, inosine and hypoxanthine recovery obtained with PRECICE® IMP, inosine, and hypoxanthine Assay kit
IMP
| Added (µmol/g) | Recovered (mmol/kg) | Recovery (%) |
|---|---|---|
| 1.0 | 1.025 ± 0.019 | 103 |
| 2.0 | 1.982 ± 0.059 | 99 |
| 3.0 | 2.933 ± 0.042 | 98 |
| 3.5 | 3.369 ± 0.088 | 96 |
Inosine
| Added (µmol/g) | Recovered (mmol/kg) | Recovery (%) |
|---|---|---|
| 1.0 | 1.022 ± 0.043 | 88 |
| 2.0 | 1.960 ± 0.064 | 85 |
| 3.0 | 2.837 ± 0.144 | 84 |
| 3.5 | 2.871 ± 0.114 | 82 |
Hypoxanthine
| Added (µmol/g) | Recovered (mmol/kg) | Recovery (%) |
|---|---|---|
| 1.0 | 1.022 ± 0.043 | 102 |
| 2.0 | 1.960 ± 0.064 | 98 |
| 3.0 | 2.837 ± 0.144 | 95 |
| 3.5 | 3.336 ± 0.114 | 95 |
Nucleotides-free cod extracts were prepared by the treatment with activated charcoal, supplemented with nucleotides and used for assay.
Data Interpretation:
Due to significant variations in the absolute concentration of muscular ATP, even among specimens of the same species, the absolute concentration of a single nucleotide (IMP or hypoxanthine) can be hardly used to assess freshness. Several formulas have been proposed to assess the freshness of fish: the Ki value (Karube et al., 1984), the H-value (Huong et al., 1992), and the Fr value (Gill et al., 1987).
Click to display the formula
The H-value represents the relative concentration of hypoxanthine compared to the total amount of ATP degradation products-namely, IMP, inosine, and hypoxanthine.
 = (Hx / (IMP + Ino + Hx)) * 100")
H(%) = (Hx / (IMP + Ino + Hx)) * 100
The Fr value, on the other hand, reflects the relative concentration of IMP in relation to the sum of these same nucleotides.
 = (IMP / (IMP + Ino + Hx)) * 100")
Fr(%) = (IMP / (IMP + Ino + Hx)) * 100
The Ki value is the inverse of relative IMP concentration (explanations are shown below).
 = ((Ino + Hx) / (IMP + Ino + Hx)) * 100")
Ki(%) = ((Ino + Hx) / (IMP + Ino + Hx)) * 100
 / (IMP + Ino + Hx) × 100] + [IMP / (IMP + Ino + Hx) × 100] = 100%")
[(Ino + Hx) / (IMP + Ino + Hx) × 100] + [IMP / (IMP + Ino + Hx) × 100] = 100%
 = 100% - [IMP / (IMP + Ino + Hx)] × 100")
Ki(%) = 100% - [IMP / (IMP + Ino + Hx)] × 100
Ki value cannot be applied for the fish species with fast autolytic IMP hydrolysis such as cod (Gadus morhua), whiting (Merlangus merlangus) and pollock (Pollachius virens) since in the absence of IMP, Ki is 100%.
 = [(Ino + Hx) / (Ino + Hx)] × 100 = 100%")
Ki(%) = [(Ino + Hx) / ( IMP + Ino + Hx)] × 100 = 100%
Relative molar concentrations of nucleotides (Ki value (Karube et al, 1984) , H-value (Huong et al, 1992) and Fr value (Gill et al. 1987)) are better indicators of fish freshness since they are not influenced by extraction efficiency or variations in muscle ATP between different species (Luong et al, 1992).
References (with external links to PubMed)

- Saito, T., Aarai, K. and Matsuyoshi, M. (1959) A New Method for Estimating the Freshness of Fish. Bulletin of the Japanese Society of Scientific, 24, 749-750.
- Peter Howgate (2006) Review of the kinetics of degradation of inosine monophosphate in some species of fish during chilled storage. International Journal of Food Science & Technology (2006), 41(4):341-353
- Luong JHT, Male KB, Masson C, Nguyen AL. 1992. Hypoxanthine ratio determination in fish extract using capillary electrophoresis and immobilized enzymes. Journal of Food Science 57(1):77-81
- Watanabe E, Toyama K, Karube I, Matsuoka H, Suzuki S. 1984. Enzyme sensor for hypoxanthine and inosine determination in edible fish. Applied Microbiology and Biotechnology 19(1):18-22
- Hong H, Regenstein IM, Luo Y. 2017. The importance of ATP-related compounds for the freshness and flavour of post-mortem fish and shellfish muscle: a review. Critical Reviews in Food Science Nutrition 57(9):1787-1798.